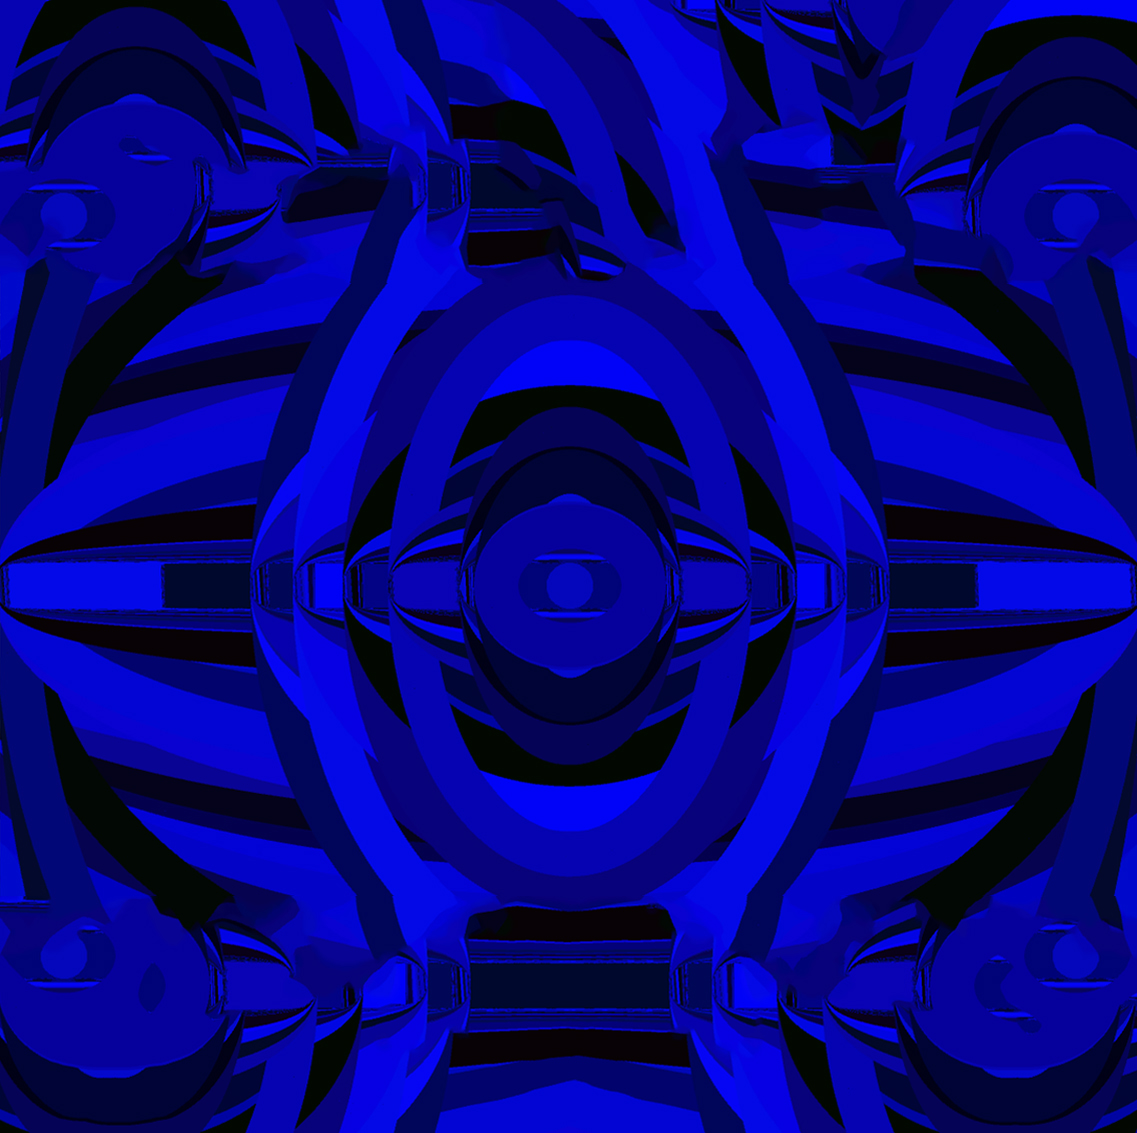
Notre projet a été conçu en partant d’un programme basique. Ce programme était destiné à décrire l’intensité d’une source sonore en la dessinant avec des barres de volume.
Nous avons décortiqué ce programme et poussé ses facultés afin de générer des images graphiques expérimentales. Pour que l’utilisateur puisse interagir en direct avec l’image nous avons inclus un potentiomètre au programme.
Le programme final permet de composer un visuel qui variera selon 2 facteurs, le son choisi, et l’intensité du potentiomètre.
code :
import ddf.minim.analysis.*;
import ddf.minim.*;
import processing.serial.*;
import cc.arduino.*;Arduino arduino;
int potar = 0;
float variable;
Minim minim;
AudioPlayer jingle;
FFT fft;void setup()
{ background(255);
size(1280, 720, P3D);minim = new Minim(this);
// specify that we want the audio buffers of the AudioPlayer
// to be 1024 samples long because our FFT needs to have
// a power-of-two buffer size and this is a good size.
jingle = minim.loadFile(« 01 Animus Vox.mp3 », 1024);// loop the file indefinitely
jingle.loop();// create an FFT object that has a time-domain buffer
// the same size as jingle’s sample buffer
// note that this needs to be a power of two
// and that it means the size of the spectrum will be half as large.
fft = new FFT( jingle.bufferSize(), jingle.sampleRate() );
println(Arduino.list());arduino = new Arduino(this, Arduino.list()[1], 57600);
arduino.pinMode(potar, Arduino.INPUT);
}void draw()
{// perform a forward FFT on the samples in jingle’s mix buffer,
// which contains the mix of both the left and right channels of the file
fft.forward( jingle.mix );
for(int i = 0; i < fft.specSize(); i++)
{
stroke(random(0,10),random(0,10),random(100,255));
strokeWeight(50);// draw the line for frequency band i, scaling it up a bit so we can see it
noFill();
ellipse(640, 360, variable*6,fft.getBand(i)*variable/6 );
variable = arduino.analogRead(potar);
variable = map(variable, 0, 1024, 0, 255);
}
}
